Health checks, logs, and statistics
Inspect PocketBase health, request logs, filters, and hourly statistics when investigating operational problems.
Use the Logs screen and the health endpoints to determine whether PocketBase is responding, which requests failed, and when failures occurred. This guide is for a superuser investigating an application that is already running.
Before you begin
You need a signed-in superuser account and the base URL of the running PocketBase instance. Avoid sharing log responses: request data can include URLs, user agents, IP addresses, and authentication context. The Logs API and the Logs screen require superuser authorization.
Inspect the Logs screen
Open Logs in the PocketBase admin UI. Leave Include requests by superusers cleared unless you are specifically investigating administrative requests.
The table shows request entries and severity, while Refresh reloads the current view. The search field accepts a term or a filter such as level > 0.
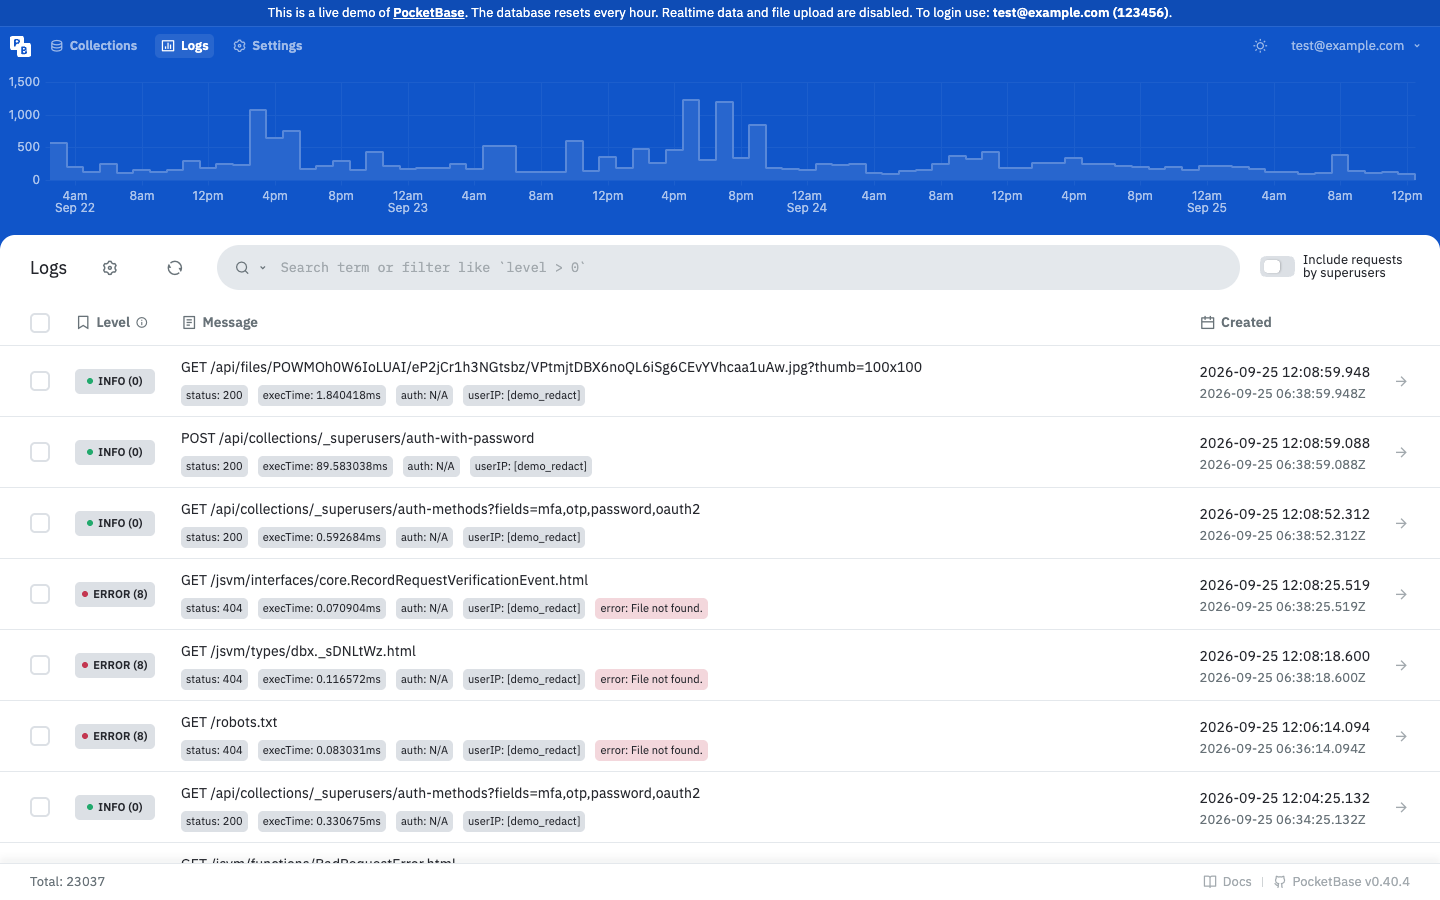
Enter a narrow filter in the search field, such as data.status >= 400, and submit it. Add a message or URL condition when you need to reduce a busy result set, for example data.url~'/api/' && data.status >= 500.
The table updates to matching entries. Use the entry's timestamp, level, message, and request data to identify the failing operation before changing application code or infrastructure.
Request the public health endpoint from the same deployment:
curl -sS https://api.example.com/api/healthAn available server returns HTTP 200 and a JSON response with message set to API is healthy.. The unauthenticated response contains an object-valued data field. With superuser authorization, the response can also report whether a backup is active, the detected real IP, and a possible proxy header.
Use the superuser session to request aggregated counts for a focused filter:
curl -sS -H 'Authorization: YOUR_SUPERUSER_TOKEN' 'https://api.example.com/api/logs/stats?filter=data.status%20%3E%3D%20400'The response is an array of hourly objects such as { "total": 4, "date": "2022-06-01 19:00:00.000" }. Treat YOUR_SUPERUSER_TOKEN as a placeholder and keep it out of shell history and support tickets.
200, the Logs screen shows the expected filtered entries, and statistics return hourly totals, the service is responding and the investigation has a bounded time window.Troubleshoot common results
An invalid filter returns a bad-request error. Check quoting, field names, and operators; supported fields include id, created, level, message, and data.*. A request without superuser authorization is rejected by the logs endpoints. If health is unavailable, test the deployment address and reverse proxy separately, then inspect the process logs before changing the application.
Do not use the truncate action as a diagnostic step. DELETE /api/logs removes all log rows and is a separate, irreversible operational action.
Next steps
For scheduled operational work, see Scheduled jobs administration. For deployment-level checks, continue with Production readiness checklist.